Flash Note: Firstrand Ltd - A Long Term Technical Sell
Summary: At a PE Ratio of 14, Firstrand appears elevated. This is in relation to it's peers, in the context of a below average SA growth rate as well as the increasing market competition. Additionally, at current levels, the market may not be discounting the R20bn execution risk of UK-based Aldermore while technically, warning signs are starting to flash. At R66.77, this share is a Portfolio Sell.
I believe one has to consider the valuation of SA Banks and whether they are indeed "value". Yes, we have the traditional metrics which is often cited such as the sector's "low" PE Ratios and very attractive, above average Dividend Yields. While these attributes are welcomed, the SA economic conditions have been relatively poor for years, so one would think that banks would trade at decade/multi-year lows. Not so. E.g. Although Absa is lower YTD, it trades near multi-year highs. Firstrand, with it's last close at R66.77, trades a mere 13.5% off it's all-time high of R77.25 reached in February 2018.
Structurally, there is massive reform needed our country to return to a normalized developing market growth rate. Unemployed remains stubbornly high, government debt is elevated, global interest rates are on the rise, commodity prices are declining (not good for ZAR) and we have new entrants into the SA banking space. Firstrand in particularly stands out as one that could see some downside on it's market valuation. At a 14 PE the market may not be discounting execution risk with the R20bn acquisition of UK-based (Aldermore) and may be investing by looking in the rear-view mirror in terms of it's innovate history, hence the premium on it's market rating relative to it's peer group.
Relative to the average PE of it's Big 4 peers, Firstrand trades at a 51% premium:
FSR 14.15
ABG 9.04
SBK 9.90
NED 9.14
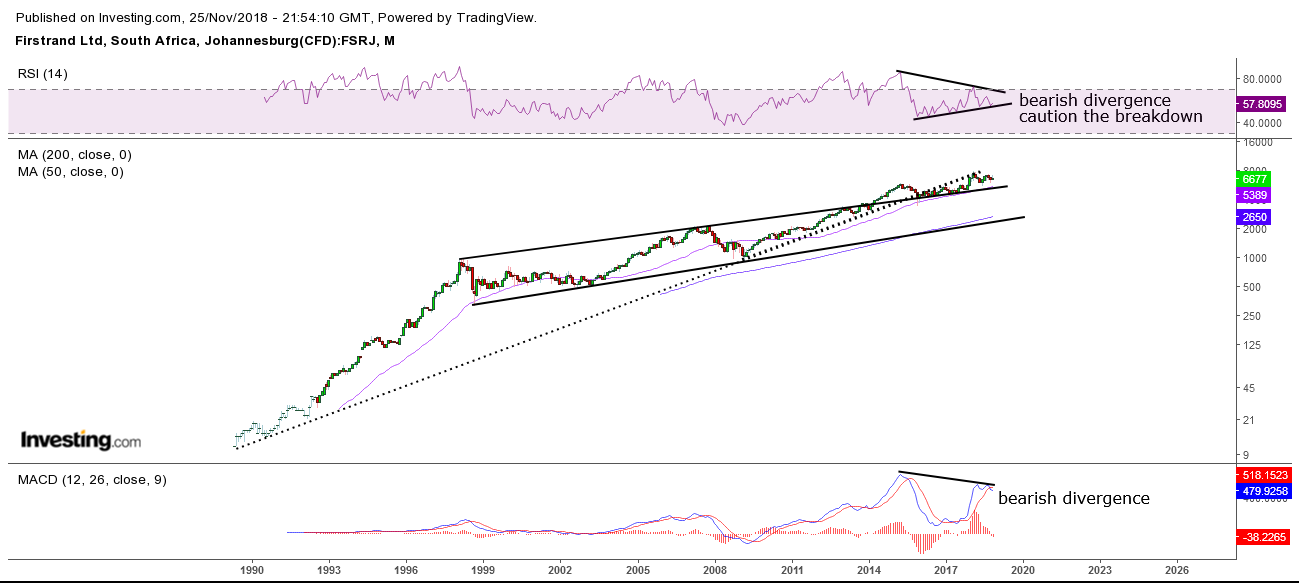
Technically, long term sell signals are starting to flash: The long term upward trend was breached in December 2015. Since then, a re-test of the breakdown level (very common price action). The technical RSI indicator has not confirmed the February 2018 highs (has made a lower high) while the price trades above the 20-year upward channel. Additionally, the MACD has signaled bearish divergence. Monthly Chart Below
I believe one has to consider the valuation of SA Banks and whether they are indeed "value". Yes, we have the traditional metrics which is often cited such as the sector's "low" PE Ratios and very attractive, above average Dividend Yields. While these attributes are welcomed, the SA economic conditions have been relatively poor for years, so one would think that banks would trade at decade/multi-year lows. Not so. E.g. Although Absa is lower YTD, it trades near multi-year highs. Firstrand, with it's last close at R66.77, trades a mere 13.5% off it's all-time high of R77.25 reached in February 2018.
Structurally, there is massive reform needed our country to return to a normalized developing market growth rate. Unemployed remains stubbornly high, government debt is elevated, global interest rates are on the rise, commodity prices are declining (not good for ZAR) and we have new entrants into the SA banking space. Firstrand in particularly stands out as one that could see some downside on it's market valuation. At a 14 PE the market may not be discounting execution risk with the R20bn acquisition of UK-based (Aldermore) and may be investing by looking in the rear-view mirror in terms of it's innovate history, hence the premium on it's market rating relative to it's peer group.
Relative to the average PE of it's Big 4 peers, Firstrand trades at a 51% premium:
FSR 14.15
ABG 9.04
SBK 9.90
NED 9.14
Technically, long term sell signals are starting to flash: The long term upward trend was breached in December 2015. Since then, a re-test of the breakdown level (very common price action). The technical RSI indicator has not confirmed the February 2018 highs (has made a lower high) while the price trades above the 20-year upward channel. Additionally, the MACD has signaled bearish divergence. Monthly Chart Below


Comments
Post a Comment