Posts

Showing posts from November, 2018

Flash Note: Firstrand Ltd - A Long Term Technical Sell

Image
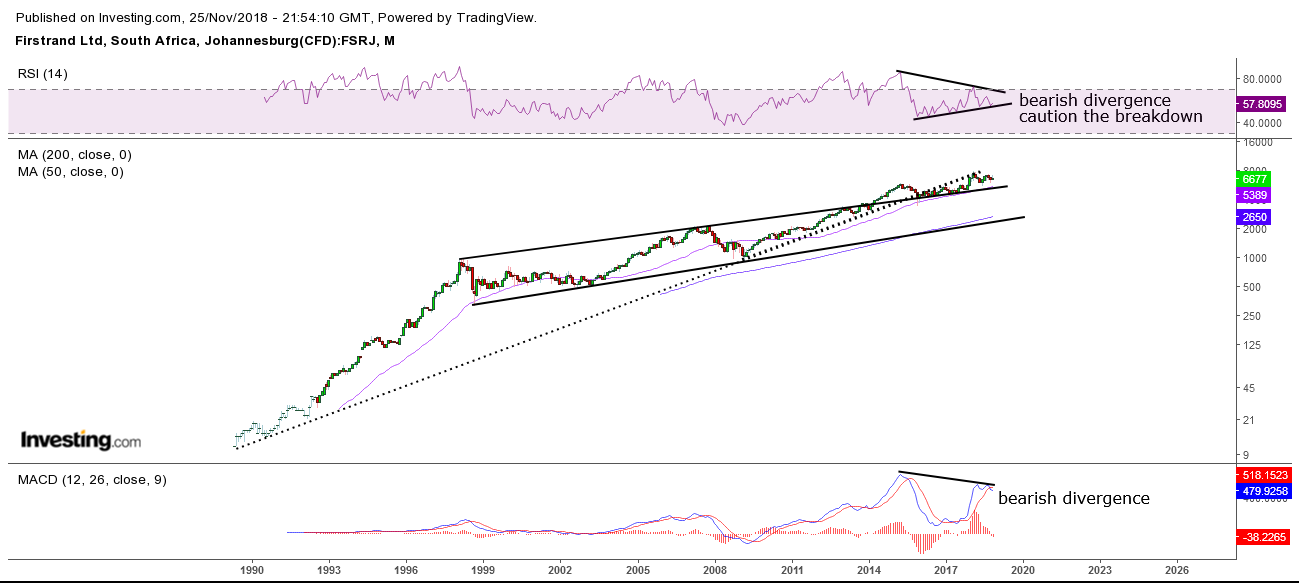
Summary: At a PE Ratio of 14, Firstrand appears elevated. This is in relation to it's peers, in the context of a below average SA growth rate as well as the increasing market competition. Additionally, at current levels, the market may not be discounting the R20bn execution risk of UK-based Aldermore while technically, warning signs are starting to flash. At R66.77, this share is a Portfolio Sell .        I believe one has to consider  the valuation of SA Banks and whether they are indeed "value". Yes, we have the traditional metrics which is often cited such as the sector's "low" PE Ratios and very attractive, above average Dividend Yields. While these attributes are welcomed, the SA economic conditions have been relatively poor for years, so one would think that banks would trade at decade/multi-year lows. Not so. E.g. Although Absa is lower YTD, it trades near multi-year highs. Firstrand, with it's last close at R66.77, trades a mere 13.5% off i

Flash Note: Boeing, A Long Term Technical Sell

Image
Summary: At $335.95, Boeing is a long term, technical SELL. Over the last decade, Boeing Inc has been one of the strongest stocks in Dow 30, surging 8-fold as the US economy recovery and the government's defense spending increased. In addition, geopolitical tensions as well as a growing global economy were strong catalysts for earnings and revenue growth over the last number years. As far as the stock price is concerned, the market appears to be discounting a perpetual high growth scenario, with the stock trading at all-time highs while earnings are also at a multi-year peak. From a fundamental valuation perspective, the share trades at 19 x earnings, while EV/EBITDA is at 15.3x (declining from the recent highs which was in line with a level last seen in January 2010) while hedge fund ownership is starting to roll over, reflecting growing selling pressure. In terms of the technical charting setup, the price trades at the overhead trend line resistance level going ba

Flash Note: Sappi Ltd, Long Term Sell?

Image
Sappi - having a look at the monthly/long term chart. Some readers may recall I had a note in Feb 2017 warning on "Sappi's Share Slowdown". At the time SAP was trading at R84.75 since then has traded in a range of between R78 and R104. While the early to mid R70s appear to be a "comfortable long", this is what I see on the Monthly Chart:  - Upward trend line going back to August 2013 has been breached. See the prior trend line breaks has provided great long term entry/exit signals.   - Has formed a medium term triple top (May 2017, Dec 2017 and September 2018).  - A key level is R85.25 - a level that, over the long term, the share has struggled to hold onto for extended periods of time. This goes back to 2001. - RSI appears vulnerable on support going back to the March 2009 incline support.  - Accumulation/Distribution Indicator is losing long term momentum, possibly reflecting buying fatigue and selling pressure.   Bottom Line : Is Sappi a